Tech Stocks Fall as Nvidia Faces Leadership Crisis
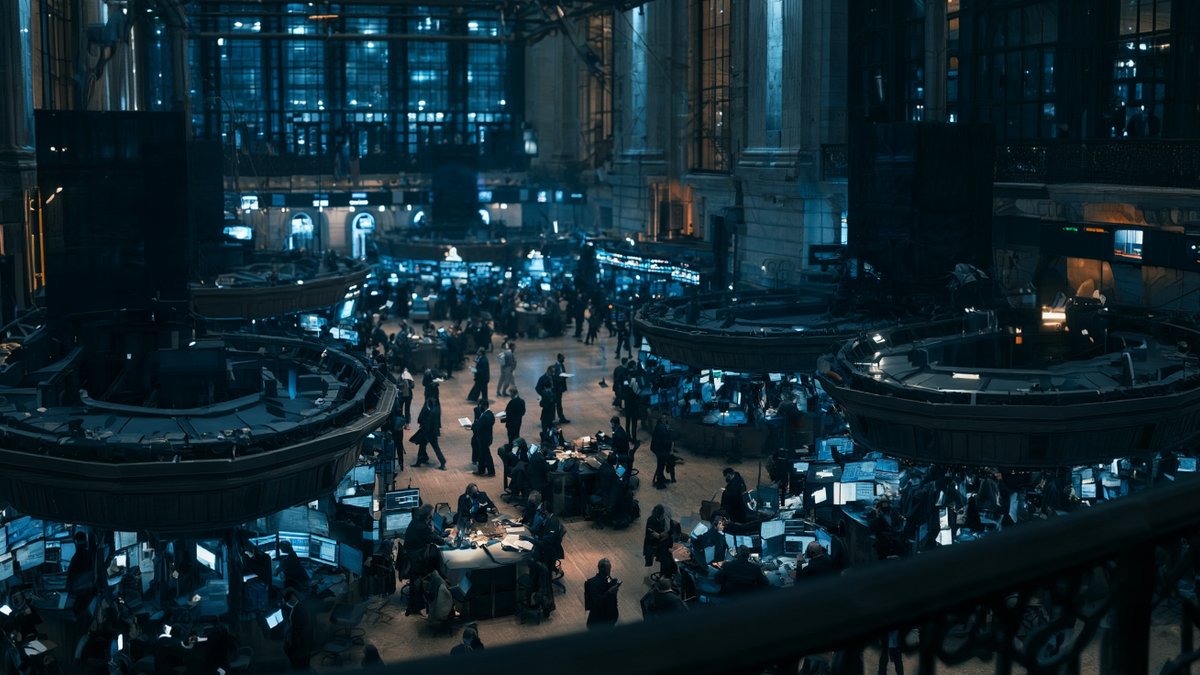
On Friday, November 13, 2026, the U.S. stock market exhibited a mixed performance, with technology stocks experiencing a decline in anticipation of significant challenges for the artificial intelligence sector. The Nasdaq Composite index dropped by 0.91%, while the S&P 500 index fell by 0.40%. In contrast, the Dow Jones Industrial Average saw a slight increase of approximately 0.1%. Despite the decline on Friday, all three major indexes managed to end the week with gains.
Index Performance
The closing levels on Friday highlighted the disparity between technology stocks and the broader market:
- Dow Jones Industrial Average: 52,347.55, with a daily change of approximately +0.10%
- S&P 500: 7,561.67, with a decline of 0.40%
- Nasdaq Composite: 25,136.27, with a drop of 0.91%
Most sectors within the S&P 500 index saw gains, even as technology stocks declined, indicating that the selling pressure on Friday was concentrated rather than widespread. For the week, the S&P 500 index rose by approximately 2.51%, the Nasdaq index increased by 2.27%, and the Dow Jones Industrial Average advanced by 2.07%. These weekly gains reflect the strength of the early-week rebound, which outweighed the subsequent decline in technology stocks.
Nvidia’s Leadership Transition
Nvidia continued to face pressure following the resignation of Jensen Huang, with the company’s stock price declining on Friday. This extended a period of turmoil for Nvidia and its associated artificial intelligence businesses. Interim CEO Colette Kress now faces scrutiny over the company’s strategic direction and investor confidence.
According to market updates, Nvidia’s stock price fell by approximately 2% on Friday, resulting in a weekly decline of 12.75%. The company’s upcoming earnings report on Tuesday will provide investors with an opportunity to assess its operating performance separately from the leadership crisis.
Investors are seeking clarity on various aspects, including customer commitments, infrastructure spending, and financing arrangements that support Nvidia’s ecosystem. Strong revenue alone may not be sufficient to alleviate concerns about the durability of these relationships.
Nvidia, a dominant player in the artificial intelligence sector, is undergoing a leadership transition, which has created uncertainty about the company’s ability to maintain its pace of innovation and handle future challenges. The market is closely watching the company’s next steps, and analysts and shareholders will be scrutinizing its decisions.
Upcoming Valuation Tests
The impending listing of Anthropic introduces a new challenge: determining the valuation of a leading artificial intelligence model developer. According to a Wall Street Journal report, CEO Dario Amodei stated that he hopes the company will “underpromise and overdeliver” during a discussion with JPMorgan Chase CEO Jamie Dimon. Anthropic is reportedly targeting a valuation of around $1.33 trillion or more, with trading expected to begin on Thursday.
Related Post: European stocks rise on oil drop and Middle East talks
Weekly Stock Winners and Losers
The weekly figures show significant dispersion within the technology sector. The contrast between AMD and Nvidia suggests that investors are differentiating between various artificial intelligence exposures rather than rejecting the entire sector. However, weekly stock price changes alone cannot establish lasting shifts in competitive position.
The leading gainers include AMD, with a weekly increase of +18.93%, Broadcom, with a gain of +18.16%, and Monolithic Power Systems, with a rise of +16.81%. Astera Labs and Rocket Lab also saw significant gains, with weekly increases of +16.32% and +15.94%, respectively. These leaders highlight where investors are finding relative value within the broader technology group.
On the other hand, the largest weekly decline was recorded by Strategy, with a drop of −13.43%, followed by Nvidia, with a decline of −12.75%, and Moderna, with a fall of −12.12%. Nebius Group and PDD Holdings also saw significant declines, with weekly drops of −10.51% and −4.89%, respectively. These losses illustrate the volatility and uneven performance across the sector.
Global Markets and Inflation
The U.S. inflation data presented a mixed picture. The producer price index rose by 0.3% in October, slightly below the consensus forecast of 0.4%. However, the annual wholesale inflation rate accelerated to 6.5%, its highest level since November 2022. Earlier consumer inflation data also showed stronger-than-expected results, with the headline CPI rising by 0.4% monthly and the core CPI increasing by 0.3%, each exceeding forecasts by 0.1 percentage point.
The benchmark 10-year Treasury yield moved toward 5.15%, maintaining pressure on rate-sensitive assets. Eurostat’s October flash estimate put the euro-area annual inflation rate at 4.0%, up from 3.8% in September. Energy remained the dominant component, rising by 20.8% annually, while services inflation reached 3.3%.
Commodities and Energy
Brent crude oil settled at $95.84 per barrel, edging up by $0.02, while West Texas Intermediate finished at $88.56, down by $0.18, or 0.20%. Both benchmarks recorded their second consecutive weekly decline. Concerns about Persian Gulf supplies continued to support prices, while expectations of stronger global supplies pushed in the opposite direction.
Gold traded at $3,883.40 per ounce on November 13, gaining $7, or 0.18%. Prices ranged between $3,867.40 and $3,924 during the session. Gold’s historical performance shows that the price is down 4.59% over seven days and 5.39% over 30 days. The six-month decline reached 14.45%.
European gas prices require particular caution. An early report quoted front-month Dutch TTF at €96.18 per megawatt-hour, while later market-tracking data showed approximately €89.40. The underlying concern remains winter supply security amid disrupted Gulf LNG flows.


